ATFGraph — hosted service
Install the tools for hosted ATFGraph. Build Python agent nodes with Claude Code, deploy to dev, and inspect every run in desktop Console.
atfgraph-dist distributes the CLI, SDK, Claude Code plugin, Console and user documentation. Your tools run locally; your deployed nodes run on the hosted service managed by AI-LAB.
Documentation · Quickstart · CLI reference · Downloads

Watch the overview
ATFGraph + Keel · 1:32
Open or download the video. A concept illustration of coordinated capabilities, not a recording of the hello-world walkthrough. Playback starts when you press Play.
Install ATFGraph, describe a hello-world node in Claude Code, deploy it to dev, and see its run in the desktop Console. This walkthrough uses macOS and the team sandbox; substitute your approved team and project.
1. Install
You need Homebrew, GitHub CLI, access to fclimited/atfgraph-dist, and Claude Code. Install Claude Code first so ATFGraph can register its plugin automatically. On Intel Macs, Python 3.11+ must also be on PATH; Homebrew supplies Python on Apple Silicon.
gh auth login
gh auth setup-git
brew tap fclimited/atfgraph https://github.com/fclimited/atfgraph-dist.git
export HOMEBREW_GITHUB_API_TOKEN="$(gh auth token --hostname github.com)"
brew install --cask fclimited/atfgraph/atfgraph-console --appdir="$HOME/Applications"
unset HOMEBREW_GITHUB_API_TOKEN
This installs the CLI, Python SDK/build tools, Claude plugin and Console. See installation for npm, GitHub download, Windows and Linux options.
Use the new CLI in this terminal, even if you have an older installation:
export PATH="$(brew --prefix)/opt/atfgraph/bin:$PATH"
atfg --version
atfg doctor --local
2. Sign in
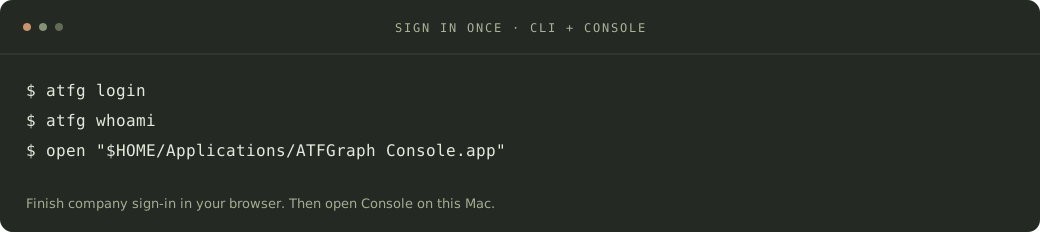
atfg login
atfg whoami
Finish the company sign-in in your browser, then return to the terminal. The CLI and Console share this session on the same computer. GitHub login is for downloads; atfg login signs you in to ATFGraph.
3. Join or create a team
atfg team ls
atfg team join sandbox
If you are already a member, skip the join request. If you need a new team instead:
atfg team create my-team --reason "Develop and test our team's nodes"
A pending request is expected. Run each command separately: exit code 3 means it is waiting for approval.
4. Get approval
A team owner approves a join request; a platform administrator approves a new team. The approver runs these commands in their own signed-in terminal:
atfg approvals
atfg approve <approval-id>
You can check progress with atfg approvals --all. After approval:
atfg team show sandbox
atfg config set team sandbox
atfg config set env dev
Use your actual team name. Creating nodes requires developer or owner access. See teams and approvals for roles and the initial-administrator exception.
5. Open the desktop Console
Sign in on this Mac before opening Console. If you opened it earlier, quit it, run atfg login, and reopen it:
open "$HOME/Applications/ATFGraph Console.app"
Allow Console to access your ATFGraph session if macOS prompts for Keychain access. Select your team and dev. A new team may have no nodes or runs yet—that is expected.
A login inside a Linux VM or container does not sign in the Mac app. Current Mac builds are not notarized; see Console setup if macOS blocks first launch.
6. Start Claude Code
Restart any Claude session that was open during installation. Check the plugin, then start in a clean workspace:
claude plugin list
mkdir -p ~/atfgraph-workspaces/first-node
cd ~/atfgraph-workspaces/first-node
claude
The plugin should appear as atfg@atfgraph-local, enabled. If it is missing, follow plugin setup.
7. Describe hello world
Paste this into Claude:
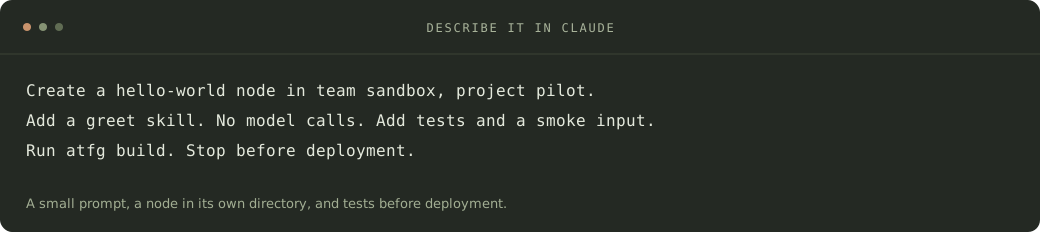
Create a simple hello-world node in team sandbox, project pilot.
Reuse the project if it exists. Add a greet skill that takes a name
and returns {"greeting": "Hello <name>!"}, with no model calls.
Create it in its own directory. Add tests and a smoke input, then
run atfg build. Stop before deployment and show me the result.
If the node name already exists, ask me for another name.
Claude uses the ATFGraph plugin to check your identity, create the project if needed, scaffold the node and write its code. Team/project names describe cloud ownership; they do not require nesting one node inside another on disk.
8. Test and build
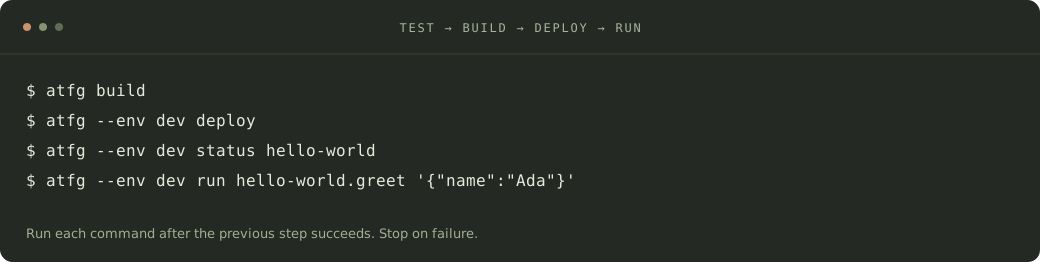
Claude should report a successful atfg build. This runs manifest, dependency, secret-file, test and lint checks. After leaving Claude, you can rerun it yourself from the node directory:
cd hello-world
atfg build
The CLI uses the managed Python environment automatically. You do not need to activate a virtual environment or install the SDK into system Python. Fix failed checks before deploying.
9. Deploy to dev and run
In Claude, ask:
Deploy this node to dev. Once it is healthy, run greet for Ada once.
Show me the deployment ID, run ID and output. Stop on any failure;
do not bump the version or retry automatically.
Or run these yourself from the node directory:
atfg --env dev deploy
atfg --env dev status hello-world
atfg --env dev run hello-world.greet '{"name":"Ada"}'
If you chose another node name, use it in these commands. The greeting should be:
{"greeting":"Hello Ada!"}
If a deployment needs approval, follow the request rather than submitting it again. If the service is unavailable, recover it and retry the existing release; a new version does not fix an infrastructure outage.
10. See it in Console
In Console, choose the same team → dev:
- Open Agents and find your deployed node and capability.
- Open Runs and find the run ID returned by the command.
- Inspect its input, output, status and recorded path.
You are done when the greeting appears in the terminal and the same successful run appears in Console. A build alone, an accepted deployment or an empty dashboard is not the end of this walkthrough.

Example multi-step run. Light mode uses the original documentation screenshot; dark mode uses the supplied run timeline. Neither is the hello-world result above.
Next: write another node, explore the Python SDK, or troubleshoot a failed step.
Understand runs and costs
As your nodes add model calls, Console can show usage and available cost data alongside the recorded execution. Observability brings together the trace, event log and run metadata.

Light mode shows Costs; dark mode shows the supplied Observability view. These are example recorded values, not usage from this walkthrough.
More documentation
- Installation options
- Teams and approvals
- Claude Code
- Python SDK
- Examples
- HTTP API and schemas
- Troubleshooting
Self-hosting
Self-hosting is possible. Contact AI-LAB for Docker, Kubernetes or other deployment options. This README covers the hosted service.